Building a complete systems-level blueprint of human biology
The Enable Lab
A high-efficiency wet lab generating petabytes of high-parameter biological data
The Enable Atlas
Our integrated, multi-modal maps of complex diseases
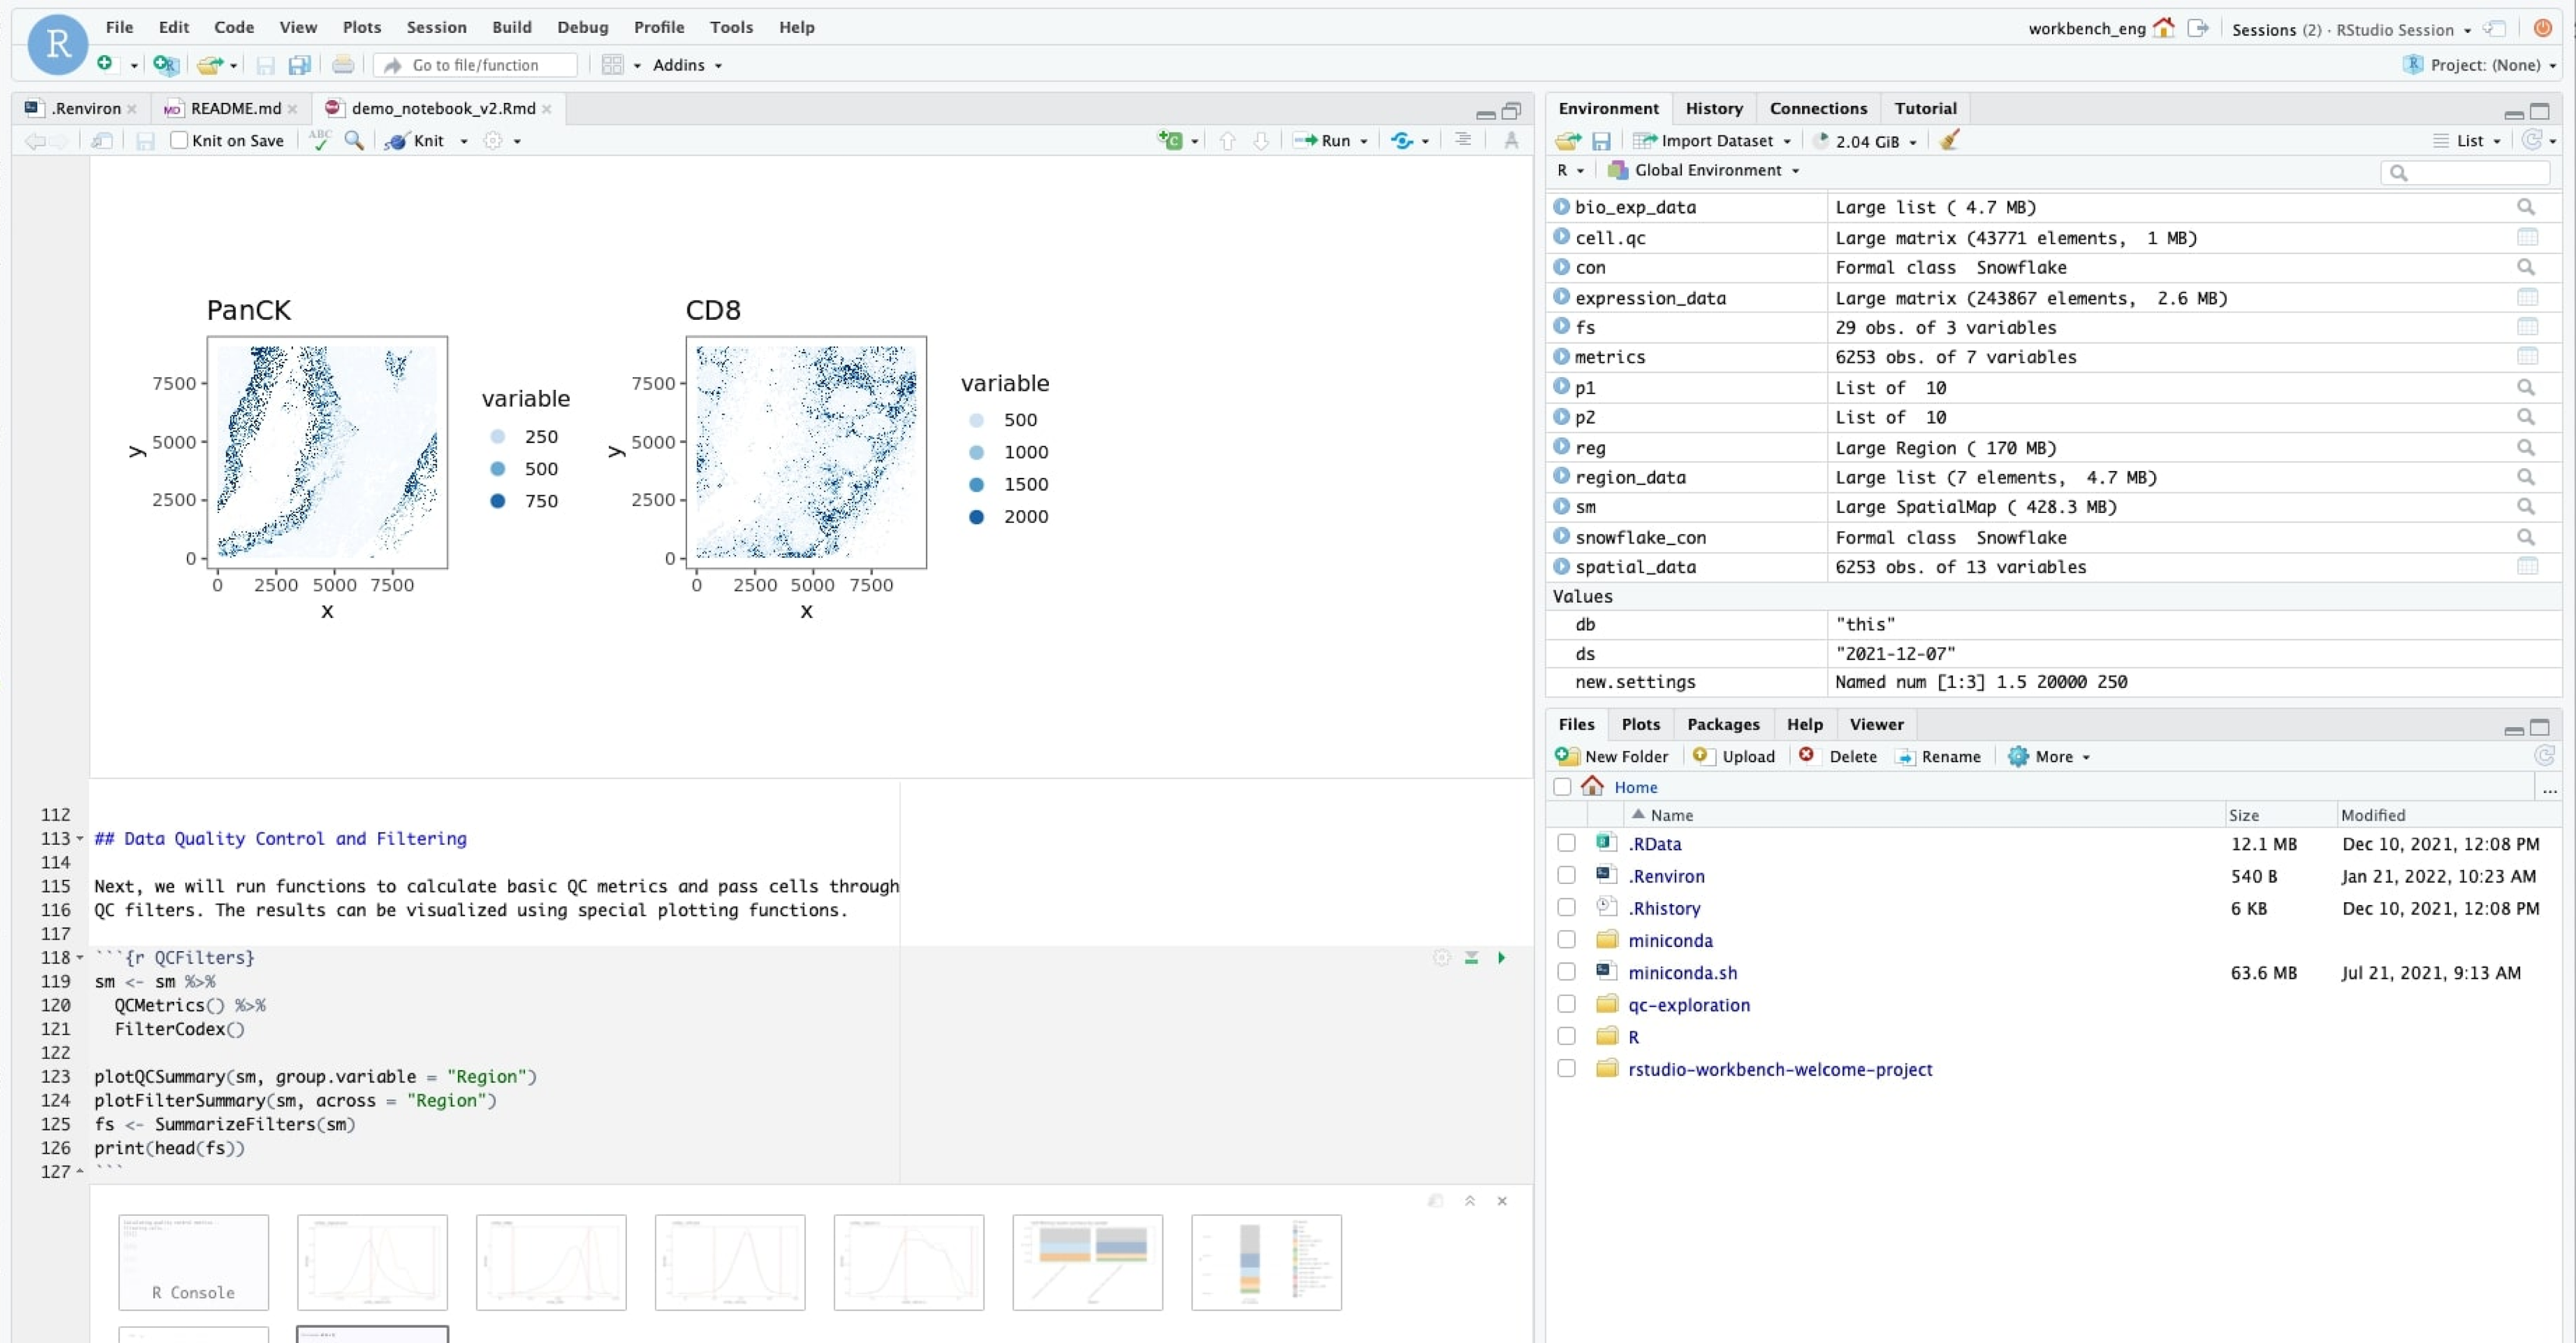
The Enable Biological Operating System (BIOS)
A combination of infrastructure and proprietary algorithms to process, organize, and analyze high-parameter biological data at scale with collaborators around the world